
Visualizing Fraction Divided by Fraction
2012-08-21 20:08
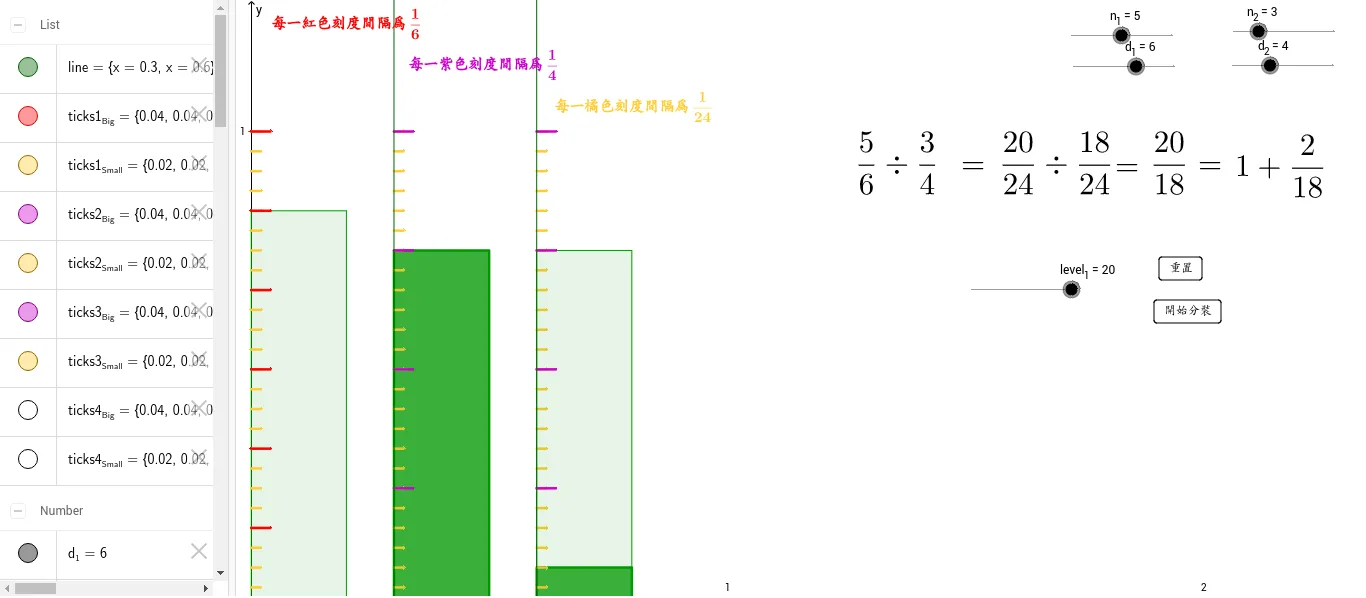
This GeoGebra applet visually demonstrates the calculation process and geometric meaning of dividing a fraction by another fraction. Through the use of bar models and tick marks, learners can see exactly how one fraction is divided by a second fraction, making an abstract arithmetic operation tangible and concrete. The applet constructs fraction bars dynamically using polygon and sequence commands. These fraction bars are marked with precise tick divisions that correspond to the denominators of the fractions involved, allowing users to count how many times the divisor fits into the dividend. This visual counting process directly reveals the quotient, while any leftover portion clearly represents the remainder. Sliders or interactive inputs allow students to change the values of the dividend and divisor in real time, observing immediately how the fraction bars and tick markings adjust. This interactivity reinforces the connection between symbolic computation and geometric representation. The applet is designed to help learners move beyond memorizing the invert-and-multiply algorithm and instead build a deep conceptual understanding of why fraction division works. By seeing the dividend bar divided into segments the size of the divisor bar, students grasp the fundamental idea that division answers the question of how many times one quantity is contained within another. The clear visual mapping between the algebraic result and the geometric model supports multiple learning styles and provides a powerful scaffold for students transitioning from whole-number division to fraction division. Educators can use this applet in classroom instruction, independent practice, or remote learning settings. It serves as an effective tool for introducing the concept, checking student understanding, and reinforcing the link between visual models and formal algorithms.
Loading the math board and drawing, please wait…
<?xml version="1.0" encoding="utf-8"?>
<geogebra format="4.0" id="df2dbace-6bc3-4b22-815c-646711f62ba0" xsi:noNamespaceSchemaLocation="http://www.geogebra.org/ggb.xsd" xmlns="" xmlns:xsi="http://www.w3.org/2001/XMLSchema-instance" >
<gui>
<window width="1366" height="768" />
<perspectives>
<perspective id="tmp">
<panes>
<pane location="" divider="0.16691068814055637" orientation="1" />
</panes>
<views>
<view id="4" toolbar="0 || 2020 , 2021 , 2022 , 66 || 2001 , 2003 , 2002 , 2004 , 2005 || 2040 , 2041 , 2042 , 2044 , 2043" visible="false" inframe="false" stylebar="false" location="1,1" size="300" window="100,100,600,400" />
<view id="1" visible="true" inframe="false" stylebar="false" location="1" size="1117" window="100,100,600,400" />
<view id="2" visible="true" inframe="false" stylebar="false" location="3" size="228" window="100,100,250,400" />
<view id="16" visible="false" inframe="true" stylebar="false" location="1" size="150" window="50,50,500,500" />
<view id="32" visible="false" inframe="true" stylebar="true" location="1" size="150" window="50,50,500,500" />
<view id="64" visible="false" inframe="true" stylebar="false" location="1" size="150" window="50,50,500,500" />
</views>
<toolbar show="true" items="0 39 59 || 1 501 67 , 5 19 , 72 | 2 15 45 , 18 65 , 7 37 | 4 3 8 9 , 13 44 , 58 , 47 || 16 51 64 , 70 | 10 34 53 11 , 24 20 22 , 21 23 | 55 56 57 , 12 || 36 46 , 38 49 50 , 71 | 30 29 54 32 31 33 | 17 26 62 , 14 66 68 | 25 52 60 61 || 40 41 42 , 27 28 35 , 6" />
<input show="true" cmd="true" top="false" />
</perspective>
</perspectives>
<labelingStyle val="3"/>
<font size="12"/>
<graphicsSettings javaLatexFonts="false"/>
<consProtColumns col0="true" col1="true" col2="false" col3="true" col4="false" col5="true" col6="true" col7="false"/>
<consProtocol useColors="true" addIcons="false" showOnlyBreakpoints="false"/>
</gui>
<euclidianView>
<size width="1117" height="610"/>
<coordSystem xZero="15.257221447833215" yZero="607.2390449212672" scale="475.7233361358251" yscale="475.72333613582344"/>
<evSettings axes="true" grid="false" gridIsBold="false" pointCapturing="3" rightAngleStyle="1" checkboxSize="13" gridType="0"/>
<bgColor r="255" g="255" b="255"/>
<axesColor r="0" g="0" b="0"/>
<gridColor r="192" g="192" b="192"/>
<lineStyle axes="1" grid="10"/>
<axis id="0" show="true" label="x" unitLabel="" tickStyle="0" showNumbers="true" tickDistance="1.0" positiveAxis="true"/>
<axis id="1" show="true" label="y" unitLabel="" tickStyle="1" showNumbers="true" tickDistance="1.0" positiveAxis="true"/>
</euclidianView>
<kernel>
<continuous val="false"/>
<decimals val="2"/>
<angleUnit val="degree"/>
<algebraStyle val="0"/>
<coordStyle val="0"/>
<angleFromInvTrig val="false"/>
</kernel>
<scripting blocked="false" disabled="false"/>
<construction title="" author="" date="">
<element type="numeric" label="Δ_{Bar}">
<value val="0.3"/>
<show object="false" label="true"/>
<objColor r="0" g="0" b="0" alpha="0.1"/>
<layer val="0"/>
<labelMode val="1"/>
<slider min="-5" max="5" absoluteScreenLocation="true" width="100.0" x="30.0" y="250.0" fixed="false" horizontal="true"/>
<lineStyle thickness="2" type="0" typeHidden="1"/>
<animation step="0.1" speed="1" type="0" playing="false"/>
</element>
<element type="numeric" label="n_2">
<value val="3.0"/>
<show object="true" label="true"/>
<objColor r="0" g="0" b="0" alpha="0.1"/>
<layer val="0"/>
<labelMode val="1"/>
<slider min="1" max="9" absoluteScreenLocation="true" width="100.0" x="997.0" y="32.0" fixed="true" horizontal="true"/>
<lineStyle thickness="2" type="0" typeHidden="1"/>
<animation step="1" speed="1" type="0" playing="false"/>
</element>
<element type="numeric" label="d_1">
<value val="6.0"/>
<show object="true" label="true"/>
<objColor r="0" g="0" b="0" alpha="0.1"/>
<layer val="0"/>
<labelMode val="1"/>
<slider min="1" max="9" absoluteScreenLocation="true" width="100.0" x="837.0" y="67.0" fixed="true" horizontal="true"/>
<lineStyle thickness="2" type="0" typeHidden="1"/>
<animation step="1" speed="1" type="0" playing="false"/>
</element>
<element type="numeric" label="d_2">
<value val="4.0"/>
<show object="true" label="true"/>
<objColor r="0" g="0" b="0" alpha="0.1"/>
<layer val="0"/>
<labelMode val="1"/>
<slider min="1" max="9" absoluteScreenLocation="true" width="100.0" x="996.0" y="66.0" fixed="true" horizontal="true"/>
<lineStyle thickness="2" type="0" typeHidden="1"/>
<animation step="1" speed="1" type="0" playing="false"/>
</element>
<element type="numeric" label="width_{Bar}">
<value val="0.2"/>
<show object="false" label="true"/>
<objColor r="0" g="0" b="0" alpha="0.1"/>
<layer val="0"/>
<labelMode val="1"/>
<animation step="0.1" speed="1" type="0" playing="false"/>
</element>
<element type="numeric" label="level_1">
<value val="20.0"/>
<show object="true" label="true"/>
<objColor r="0" g="0" b="0" alpha="0.1"/>
<layer val="3"/>
<labelMode val="1"/>
<slider min="0" max="n_1 * d_2" absoluteScreenLocation="true" width="100.0" x="735.0" y="290.0" fixed="true" horizontal="true"/>
<lineStyle thickness="2" type="0" typeHidden="1"/>
<animation step="1" speed="1" type="3" playing="false"/>
</element>
<command name="If">
<input a0="level_1 < n_2 * d_1" a1="level_1" a2="n_2 * d_1"/>
<output a0="level_2"/>
</command>
<element type="numeric" label="level_2">
<value val="18.0"/>
<objColor r="0" g="0" b="0" alpha="0.1"/>
</element>
<element type="numeric" label="n_1">
<value val="5.0"/>
<show object="true" label="true"/>
<objColor r="0" g="0" b="0" alpha="0.1"/>
<layer val="0"/>
<labelMode val="1"/>
<slider min="1" max="9" absoluteScreenLocation="true" width="100.0" x="835.0" y="36.0" fixed="true" horizontal="true"/>
<lineStyle thickness="2" type="0" typeHidden="1"/>
<animation step="1" speed="1" type="0" playing="false"/>
</element>
<expression label="text1" exp=""\frac{" + (LaTeX[n_1]) + "}{" + (LaTeX[d_1]) + "}÷\frac{" + (LaTeX[n_2]) + "}{" + (LaTeX[d_2]) + "}"" />
<element type="text" label="text1">
<show object="true" label="false"/>
<objColor r="0" g="0" b="0" alpha="0.0"/>
<layer val="0"/>
<labelMode val="0"/>
<isLaTeX val="true"/>
<font serif="true" size="16" style="0"/>
<absoluteScreenLocation x="613" y="126"/>
</element>
<command name="Div">
<input a0="n_1 * d_2" a1="n_2 * d_1"/>
<output a0="q"/>
</command>
<element type="numeric" label="q">
<value val="1.0"/>
<objColor r="0" g="0" b="0" alpha="0.1"/>
</element>
<command name="Mod">
<input a0="n_1 * d_2" a1="n_2 * d_1"/>
<output a0="r"/>
</command>
<element type="numeric" label="r">
<value val="2.0"/>
<objColor r="0" g="0" b="0" alpha="0.1"/>
</element>
<expression label="p" exp="n_2 * d_1" />
<element type="numeric" label="p">
<value val="18.0"/>
<objColor r="0" g="0" b="0" alpha="0.1"/>
</element>
<expression label="text2" exp=""" + (LaTeX[q]) + "+\frac{" + (LaTeX[r]) + "}{" + (LaTeX[p]) + "}"" />
<element type="text" label="text2">
<show object="true" label="false"/>
<condition showObject="q > 0"/>
<objColor r="0" g="0" b="0" alpha="0.0"/>
<layer val="0"/>
<labelMode val="0"/>
<isLaTeX val="true"/>
<font serif="true" size="16" style="0"/>
<absoluteScreenLocation x="993" y="129"/>
</element>
<element type="numeric" label="width_{BigTick}">
<value val="0.04"/>
<show object="false" label="false"/>
<objColor r="0" g="0" b="0" alpha="0.1"/>
<layer val="0"/>
<labelMode val="1"/>
<animation step="1" speed="1" type="0" playing="false"/>
</element>
<element type="numeric" label="width_{SmallTick}">
<value val="0.02"/>
<show object="false" label="false"/>
<objColor r="0" g="0" b="0" alpha="0.1"/>
<layer val="0"/>
<labelMode val="1"/>
<animation step="1" speed="1" type="0" playing="false"/>
</element>
<command name="Sequence">
<input a0="Segment[(0, i * 1 / d_1), (0 + width_{BigTick}, i * 1 / d_1)]" a1="i" a2="1" a3="d_1"/>
<output a0="ticks1_{Big}"/>
</command>
<element type="list" label="ticks1_{Big}">
<show object="true" label="false"/>
<objColor r="255" g="0" b="0" alpha="0.0"/>
<layer val="3"/>
<labelMode val="0"/>
<lineStyle thickness="5" type="0" typeHidden="1"/>
<pointSize val="3"/>
<pointStyle val="-1"/>
</element>
<command name="Sequence">
<input a0="Segment[(Δ_{Bar}, i * 1 / d_2), (Δ_{Bar} + width_{BigTick}, i * 1 / d_2)]" a1="i" a2="1" a3="d_2"/>
<output a0="ticks2_{Big}"/>
</command>
<element type="list" label="ticks2_{Big}">
<show object="true" label="true"/>
<objColor r="204" g="0" b="204" alpha="0.0"/>
<layer val="3"/>
<labelMode val="0"/>
<lineStyle thickness="5" type="0" typeHidden="1"/>
<pointSize val="3"/>
<pointStyle val="-1"/>
</element>
<command name="Sequence">
<input a0="Segment[(0, i * 1 / (d_1 * d_2)), (0 + width_{SmallTick}, i * 1 / (d_1 * d_2))]" a1="i" a2="1" a3="d_1 * d_2"/>
<output a0="ticks1_{Small}"/>
</command>
<element type="list" label="ticks1_{Small}">
<show object="true" label="false"/>
<objColor r="255" g="204" b="51" alpha="0.0"/>
<layer val="2"/>
<labelMode val="0"/>
<lineStyle thickness="5" type="0" typeHidden="1"/>
<pointSize val="3"/>
<pointStyle val="-1"/>
</element>
<command name="Sequence">
<input a0="Segment[(Δ_{Bar}, i * 1 / (d_1 * d_2)), (Δ_{Bar} + width_{SmallTick}, i * 1 / (d_1 * d_2))]" a1="i" a2="1" a3="d_1 * d_2"/>
<output a0="ticks2_{Small}"/>
</command>
<element type="list" label="ticks2_{Small}">
<show object="true" label="false"/>
<objColor r="255" g="204" b="51" alpha="0.0"/>
<layer val="2"/>
<labelMode val="0"/>
<lineStyle thickness="5" type="0" typeHidden="1"/>
<pointSize val="3"/>
<pointStyle val="-1"/>
</element>
<command name="Polygon">
<input a0="{(0, 0), (0 + width_{Bar}, 0), (0 + width_{Bar}, (n_1 * d_2 - level_1) / (d_1 * d_2)), (0, (n_1 * d_2 - level_1) / (d_1 * d_2))}"/>
<output a0="Bar1'" a1="Bar1'_a" a2="Bar1'_b" a3="Bar1'_c" a4="Bar1'_d"/>
</command>
<element type="polygon" label="Bar1'">
<lineStyle thickness="5" type="0" typeHidden="1"/>
<show object="true" label="false"/>
<objColor r="0" g="153" b="0" alpha="0.75"/>
<layer val="1"/>
<labelMode val="0"/>
</element>
<element type="segment" label="Bar1'_a">
<show object="false" label="false"/>
<objColor r="0" g="0" b="0" alpha="0.0"/>
<layer val="1"/>
<labelMode val="0"/>
<coords x="0.0" y="0.2" z="0.0"/>
<lineStyle thickness="3" type="0" typeHidden="1"/>
<eqnStyle style="implicit"/>
<outlyingIntersections val="false"/>
<keepTypeOnTransform val="true"/>
</element>
<element type="segment" label="Bar1'_b">
<show object="false" label="false"/>
<objColor r="0" g="0" b="0" alpha="0.0"/>
<layer val="1"/>
<labelMode val="0"/>
<coords x="0.0" y="0.0" z="0.0"/>
<lineStyle thickness="3" type="0" typeHidden="1"/>
<eqnStyle style="implicit"/>
<outlyingIntersections val="false"/>
<keepTypeOnTransform val="true"/>
</element>
<element type="segment" label="Bar1'_c">
<show object="false" label="false"/>
<objColor r="0" g="0" b="0" alpha="0.0"/>
<layer val="1"/>
<labelMode val="0"/>
<coords x="0.0" y="-0.2" z="0.0"/>
<lineStyle thickness="3" type="0" typeHidden="1"/>
<eqnStyle style="implicit"/>
<outlyingIntersections val="false"/>
<keepTypeOnTransform val="true"/>
</element>
<element type="segment" label="Bar1'_d">
<show object="false" label="false"/>
<objColor r="0" g="0" b="0" alpha="0.0"/>
<layer val="1"/>
<labelMode val="0"/>
<coords x="0.0" y="0.0" z="0.0"/>
<lineStyle thickness="3" type="0" typeHidden="1"/>
<eqnStyle style="implicit"/>
<outlyingIntersections val="false"/>
<keepTypeOnTransform val="true"/>
</element>
<command name="Polygon">
<input a0="{(Δ_{Bar}, 0), (Δ_{Bar} + width_{Bar}, 0), (Δ_{Bar} + width_{Bar}, n_2 / d_2), (Δ_{Bar}, n_2 / d_2)}"/>
<output a0="Bar2" a1="" a2="" a3="" a4=""/>
</command>
<element type="polygon" label="Bar2">
<lineStyle thickness="2" type="0" typeHidden="1"/>
<show object="true" label="false"/>
<objColor r="0" g="153" b="0" alpha="0.1"/>
<layer val="2"/>
<labelMode val="0"/>
</element>
<command name="Sequence">
<input a0="Segment[(2 * Δ_{Bar}, i * 1 / d_2), (2 * Δ_{Bar} + width_{BigTick}, i * 1 / d_2)]" a1="i" a2="1" a3="d_2"/>
<output a0="ticks3_{Big}"/>
</command>
<element type="list" label="ticks3_{Big}">
<show object="true" label="false"/>
<condition showObject="(q > 1) ∨ q ≟ 1 ∧ (r > 0)"/>
<objColor r="204" g="0" b="204" alpha="0.0"/>
<layer val="3"/>
<labelMode val="0"/>
<lineStyle thickness="5" type="0" typeHidden="1"/>
<pointSize val="3"/>
<pointStyle val="-1"/>
</element>
<command name="Sequence">
<input a0="Segment[(2 * Δ_{Bar}, i * 1 / (d_1 * d_2)), (2 * Δ_{Bar} + width_{SmallTick}, i * 1 / (d_1 * d_2))]" a1="i" a2="1" a3="d_1 * d_2"/>
<output a0="ticks3_{Small}"/>
</command>
<element type="list" label="ticks3_{Small}">
<show object="true" label="false"/>
<condition showObject="(q > 1) ∨ q ≟ 1 ∧ (r > 0)"/>
<objColor r="255" g="204" b="51" alpha="0.0"/>
<layer val="2"/>
<labelMode val="0"/>
<lineStyle thickness="5" type="0" typeHidden="1"/>
<pointSize val="3"/>
<pointStyle val="-1"/>
</element>
<command name="Polygon">
<input a0="{(2 * Δ_{Bar}, 0), (2 * Δ_{Bar} + width_{Bar}, 0), (2 * Δ_{Bar} + width_{Bar}, n_2 / d_2), (2 * Δ_{Bar}, n_2 / d_2)}"/>
<output a0="Bar3" a1="" a2="" a3="" a4=""/>
</command>
<element type="polygon" label="Bar3">
<lineStyle thickness="2" type="0" typeHidden="1"/>
<show object="true" label="false"/>
<condition showObject="(q > 1) ∨ q ≟ 1 ∧ (r > 0)"/>
<objColor r="0" g="153" b="0" alpha="0.1"/>
<layer val="2"/>
<labelMode val="0"/>
</element>
<command name="Sequence">
<input a0="Segment[(3 * Δ_{Bar}, i * 1 / d_2), (3 * Δ_{Bar} + width_{BigTick}, i * 1 / d_2)]" a1="i" a2="1" a3="d_2"/>
<output a0="ticks4_{Big}"/>
</command>
<element type="list" label="ticks4_{Big}">
<show object="true" label="false"/>
<condition showObject="(q > 2) ∨ q ≟ 2 ∧ (r > 0)"/>
<objColor r="204" g="0" b="204" alpha="0.0"/>
<layer val="3"/>
<labelMode val="0"/>
<lineStyle thickness="5" type="0" typeHidden="1"/>
<pointSize val="3"/>
<pointStyle val="-1"/>
</element>
<command name="Sequence">
<input a0="Segment[(3 * Δ_{Bar}, i * 1 / (d_1 * d_2)), (3 * Δ_{Bar} + width_{SmallTick}, i * 1 / (d_1 * d_2))]" a1="i" a2="1" a3="d_1 * d_2"/>
<output a0="ticks4_{Small}"/>
</command>
<element type="list" label="ticks4_{Small}">
<show object="true" label="false"/>
<condition showObject="(q > 2) ∨ q ≟ 2 ∧ (r > 0)"/>
<objColor r="255" g="204" b="51" alpha="0.0"/>
<layer val="2"/>
<labelMode val="0"/>
<lineStyle thickness="5" type="0" typeHidden="1"/>
<pointSize val="3"/>
<pointStyle val="-1"/>
</element>
<command name="Polygon">
<input a0="{(3 * Δ_{Bar}, 0), (3 * Δ_{Bar} + width_{Bar}, 0), (3 * Δ_{Bar} + width_{Bar}, n_2 / d_2), (3 * Δ_{Bar}, n_2 / d_2)}"/>
<output a0="Bar4" a1="" a2="" a3="" a4=""/>
</command>
<element type="polygon" label="Bar4">
<lineStyle thickness="2" type="0" typeHidden="1"/>
<show object="true" label="false"/>
<condition showObject="(q > 2) ∨ q ≟ 2 ∧ (r > 0)"/>
<objColor r="0" g="153" b="0" alpha="0.1"/>
<layer val="2"/>
<labelMode val="0"/>
</element>
<command name="Polygon">
<input a0="{(0, 0), (0 + width_{Bar}, 0), (0 + width_{Bar}, n_1 / d_1), (0, n_1 / d_1)}"/>
<output a0="Bar1" a1="" a2="" a3="" a4=""/>
</command>
<element type="polygon" label="Bar1">
<lineStyle thickness="2" type="0" typeHidden="1"/>
<show object="true" label="false"/>
<objColor r="0" g="153" b="0" alpha="0.1"/>
<layer val="0"/>
<labelMode val="0"/>
</element>
<command name="Polygon">
<input a0="{(Δ_{Bar}, 0), (Δ_{Bar} + width_{Bar}, 0), (Δ_{Bar} + width_{Bar}, level_2 / (d_1 * d_2)), (Δ_{Bar}, level_2 / (d_1 * d_2))}"/>
<output a0="Bar2'" a1="a" a2="b" a3="c" a4="d"/>
</command>
<element type="polygon" label="Bar2'">
<lineStyle thickness="5" type="0" typeHidden="1"/>
<show object="true" label="false"/>
<objColor r="0" g="153" b="0" alpha="0.75"/>
<layer val="1"/>
<labelMode val="0"/>
</element>
<element type="segment" label="a">
<show object="true" label="false"/>
<objColor r="0" g="0" b="0" alpha="0.0"/>
<layer val="3"/>
<labelMode val="0"/>
<coords x="0.0" y="0.2" z="0.0"/>
<lineStyle thickness="5" type="0" typeHidden="1"/>
<eqnStyle style="implicit"/>
<outlyingIntersections val="false"/>
<keepTypeOnTransform val="true"/>
</element>
<element type="segment" label="b">
<show object="true" label="false"/>
<objColor r="0" g="0" b="0" alpha="0.0"/>
<layer val="3"/>
<labelMode val="0"/>
<coords x="-0.75" y="0.0" z="0.375"/>
<lineStyle thickness="5" type="0" typeHidden="1"/>
<eqnStyle style="implicit"/>
<outlyingIntersections val="false"/>
<keepTypeOnTransform val="true"/>
</element>
<element type="segment" label="c">
<show object="true" label="false"/>
<objColor r="0" g="0" b="0" alpha="0.0"/>
<layer val="3"/>
<labelMode val="0"/>
<coords x="0.0" y="-0.2" z="0.15000000000000002"/>
<lineStyle thickness="5" type="0" typeHidden="1"/>
<eqnStyle style="implicit"/>
<outlyingIntersections val="false"/>
<keepTypeOnTransform val="true"/>
</element>
<element type="segment" label="d">
<show object="true" label="false"/>
<objColor r="0" g="0" b="0" alpha="0.0"/>
<layer val="3"/>
<labelMode val="0"/>
<coords x="0.75" y="0.0" z="-0.22499999999999998"/>
<lineStyle thickness="5" type="0" typeHidden="1"/>
<eqnStyle style="implicit"/>
<outlyingIntersections val="false"/>
<keepTypeOnTransform val="true"/>
</element>
<element type="button" label="button1">
<show object="true" label="true"/>
<objColor r="0" g="0" b="0" alpha="0.0"/>
<layer val="3"/>
<labelOffset x="1777" y="338"/>
<labelMode val="0"/>
<animation step="1" speed="1" type="0" playing="false"/>
<auxiliary val="true"/>
<ggbscript val="SetValue[level_1,0] StartAnimation[false ] "/>
<caption val="復原預設值"/>
</element>
<element type="button" label="button2">
<show object="true" label="true"/>
<objColor r="0" g="0" b="0" alpha="0.0"/>
<layer val="3"/>
<labelOffset x="918" y="300"/>
<labelMode val="0"/>
<animation step="1" speed="1" type="0" playing="false"/>
<auxiliary val="true"/>
<ggbscript val="StartAnimation[level_1] "/>
<caption val="開始分裝"/>
</element>
<command name="If">
<input a0="level_1 < n_2 * d_1" a1="0" a2="If[level_1 < 2 * n_2 * d_1, level_1 - n_2 * d_1, n_2 * d_1]"/>
<output a0="level_3"/>
</command>
<element type="numeric" label="level_3">
<value val="2.0"/>
<objColor r="0" g="0" b="0" alpha="0.1"/>
</element>
<command name="Polygon">
<input a0="{(2 * Δ_{Bar}, 0), (2 * Δ_{Bar} + width_{Bar}, 0), (2 * Δ_{Bar} + width_{Bar}, level_3 / (d_1 * d_2)), (2 * Δ_{Bar}, level_3 / (d_1 * d_2))}"/>
<output a0="Bar3'" a1="" a2="" a3="" a4=""/>
</command>
<element type="polygon" label="Bar3'">
<lineStyle thickness="5" type="0" typeHidden="1"/>
<show object="true" label="false"/>
<condition showObject="(q > 1) ∨ q ≟ 1 ∧ (r > 0)"/>
<objColor r="0" g="153" b="0" alpha="0.75"/>
<layer val="1"/>
<labelMode val="0"/>
</element>
<command name="If">
<input a0="level_1 < 2 * n_2 * d_1" a1="0" a2="If[level_1 < 3 * 2 * n_2 * d_1, level_1 - 2 * n_2 * d_1, 0]"/>
<output a0="level_4"/>
</command>
<element type="numeric" label="level_4">
<value val="0.0"/>
<objColor r="0" g="0" b="0" alpha="0.1"/>
</element>
<command name="Polygon">
<input a0="{(3 * Δ_{Bar}, 0), (3 * Δ_{Bar} + width_{Bar}, 0), (3 * Δ_{Bar} + width_{Bar}, level_4 / (d_1 * d_2)), (3 * Δ_{Bar}, level_4 / (d_1 * d_2))}"/>
<output a0="Bar4'" a1="" a2="" a3="" a4=""/>
</command>
<element type="polygon" label="Bar4'">
<lineStyle thickness="5" type="0" typeHidden="1"/>
<show object="true" label="false"/>
<condition showObject="(q > 2) ∨ q ≟ 2 ∧ (r > 0)"/>
<objColor r="0" g="153" b="0" alpha="0.75"/>
<layer val="1"/>
<labelMode val="0"/>
</element>
<expression label="n_{1xd2}" exp="n_1 * d_2" />
<element type="numeric" label="n_{1xd2}">
<value val="20.0"/>
<objColor r="0" g="0" b="0" alpha="0.1"/>
</element>
<expression label="d_{1x2}" exp="d_1 * d_2" />
<element type="numeric" label="d_{1x2}">
<value val="24.0"/>
<objColor r="0" g="0" b="0" alpha="0.1"/>
</element>
<expression label="n_{2xd1}" exp="n_2 * d_1" />
<element type="numeric" label="n_{2xd1}">
<value val="18.0"/>
<objColor r="0" g="0" b="0" alpha="0.1"/>
</element>
<expression label="text4" exp=""$ \frac{" + (LaTeX[n_{1xd2}]) + "}{" + (LaTeX[d_{1x2}]) + "} ÷\frac{" + (LaTeX[n_{2xd1}]) + "}{" + (LaTeX[d_{1x2}]) + "}$"" />
<element type="text" label="text4">
<show object="true" label="false"/>
<objColor r="0" g="0" b="0" alpha="0.0"/>
<layer val="3"/>
<labelMode val="0"/>
<isLaTeX val="true"/>
<font serif="true" size="16" style="0"/>
<absoluteScreenLocation x="757" y="126"/>
</element>
<expression label="text5" exp=""=""/>
<element type="text" label="text5">
<show object="true" label="false"/>
<objColor r="0" g="0" b="0" alpha="0.0"/>
<layer val="3"/>
<labelMode val="0"/>
<isLaTeX val="true"/>
<font serif="true" size="16" style="0"/>
<absoluteScreenLocation x="873" y="147"/>
</element>
<expression label="text3" exp=""$ = $""/>
<element type="text" label="text3">
<show object="true" label="false"/>
<objColor r="0" g="0" b="0" alpha="0.0"/>
<layer val="3"/>
<labelMode val="0"/>
<isLaTeX val="true"/>
<font serif="true" size="16" style="0"/>
<absoluteScreenLocation x="719" y="145"/>
</element>
<expression label="text6" exp=""$ \frac{" + (LaTeX[n_{1xd2}]) + "}{" + (LaTeX[n_{2xd1}]) + "} $"" />
<element type="text" label="text6">
<show object="true" label="false"/>
<objColor r="0" g="0" b="0" alpha="0.0"/>
<layer val="3"/>
<labelMode val="0"/>
<isLaTeX val="true"/>
<font serif="true" size="16" style="0"/>
<absoluteScreenLocation x="908" y="126"/>
</element>
<expression label="text7" exp=""$ = $""/>
<element type="text" label="text7">
<show object="true" label="false"/>
<condition showObject="q > 0"/>
<objColor r="0" g="0" b="0" alpha="0.0"/>
<layer val="3"/>
<labelMode val="0"/>
<isLaTeX val="true"/>
<font serif="true" size="16" style="0"/>
<absoluteScreenLocation x="956" y="145"/>
</element>
<command name="Sequence">
<input a0="x = i * Δ_{Bar}" a1="i" a2="1" a3="If[r ≟ 0, q, q + 1]"/>
<output a0="line"/>
</command>
<element type="list" label="line">
<show object="true" label="true"/>
<objColor r="0" g="100" b="0" alpha="0.0"/>
<layer val="3"/>
<labelMode val="0"/>
<lineStyle thickness="2" type="0" typeHidden="1"/>
<pointSize val="3"/>
<pointStyle val="-1"/>
</element>
<element type="button" label="button3">
<show object="true" label="true"/>
<objColor r="0" g="0" b="0" alpha="0.0"/>
<layer val="3"/>
<labelOffset x="923" y="257"/>
<labelMode val="0"/>
<animation step="1" speed="1" type="0" playing="false"/>
<auxiliary val="true"/>
<ggbscript val="SetValue[level_1,0]"/>
<caption val="重置"/>
</element>
<expression label="text9" exp=""每一紫色刻度間隔為\frac{1}{" + (LaTeX[d_2]) + "}"" />
<element type="text" label="text9">
<show object="true" label="false"/>
<objColor r="204" g="0" b="204" alpha="0.0"/>
<layer val="3"/>
<labelMode val="0"/>
<isLaTeX val="true"/>
<font serif="true" size="0" style="1"/>
<startPoint x="0.3225756543068563" y="1.1767883142856486" z="1.0"/>
</element>
<expression label="text8" exp=""每一紅色刻度間隔為\frac{1}{" + (LaTeX[d_1]) + "}"" />
<element type="text" label="text8">
<show object="true" label="false"/>
<objColor r="255" g="0" b="0" alpha="0.0"/>
<layer val="3"/>
<labelMode val="0"/>
<isLaTeX val="true"/>
<font serif="true" size="0" style="1"/>
<absoluteScreenLocation x="32" y="6"/>
</element>
<expression label="text10" exp=""每一橘色刻度間隔為\frac{1}{" + (LaTeX[d_{1x2}]) + "}"" />
<element type="text" label="text10">
<show object="true" label="false"/>
<objColor r="255" g="204" b="51" alpha="0.0"/>
<layer val="3"/>
<labelMode val="0"/>
<isLaTeX val="true"/>
<font serif="true" size="0" style="1"/>
<startPoint x="0.6309990231058232" y="1.0893496399203508" z="1.0"/>
</element>
</construction>
</geogebra>