Home
›
Community Cases
›
Graphical Representation of Solutions to Linear Inequalities in One Variable
Graphical Representation of Solutions to Linear Inequalities in One Variable
2020-11-27 13:05
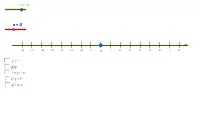
This applet demonstrates how to graph solutions to linear inequalities in one variable. By plotting the solution set on a number line, it visually illustrates the entire solving process and its final result. The interactive environment uses GeoGebra tools such as dynamic number lines, intersection points, and line segments to represent solution intervals in a clear and engaging way. Students can observe in real time how operations like adding, subtracting, multiplying, or dividing both sides of an inequality affect the direction of the inequality sign, and how these transformations are reflected geometrically on the number line. The applet highlights key concepts including the distinction between open and closed endpoints, the use of bracket and parenthesis notation, and the translation between inequality notation, interval notation, and graphical representation. By manipulating parameters and watching the number line update dynamically, learners develop an intuitive understanding of what inequality solutions actually look like as continuous regions rather than isolated points. This visual approach reinforces the properties of inequalities and helps students connect abstract algebraic procedures with their concrete geometric interpretation. The applet is particularly useful for building foundational skills in algebra, preparing students for more advanced topics such as systems of inequalities and compound inequalities.
☆
Favorite
0
Loading the math board and drawing, please wait…
<?xml version="1.0" encoding="utf-8"?>
<geogebra format="3.2">
<gui>
<show algebraView="false" spreadsheetView="false" auxiliaryObjects="true" algebraInput="true" cmdList="true"/>
<splitDivider loc="650" locVertical="400" loc2="178" locVertical2="300" horizontal="true"/>
<font size="16"/>
</gui>
<euclidianView>
<size width="1017" height="600"/>
<coordSystem xZero="512.0" yZero="230.0" scale="50.0" yscale="50.0"/>
<evSettings axes="false" grid="false" gridIsBold="false" pointCapturing="3" pointStyle="0" rightAngleStyle="1" checkboxSize="26" gridType="0"/>
<bgColor r="255" g="255" b="255"/>
<axesColor r="0" g="0" b="0"/>
<gridColor r="192" g="192" b="192"/>
<lineStyle axes="1" grid="10"/>
<axis id="0" show="false" label="" unitLabel="" tickStyle="1" showNumbers="true"/>
<axis id="1" show="false" label="" unitLabel="" tickStyle="1" showNumbers="true"/>
</euclidianView>
<kernel>
<continuous val="false"/>
<decimals val="2"/>
<angleUnit val="degree"/>
<algebraStyle val="0"/>
<coordStyle val="0"/>
</kernel>
<construction title="" author="Paul" date="">
<element type="numeric" label="n">
<value val="16.0"/>
<show object="true" label="true"/>
<objColor r="51" g="102" b="0" alpha="0.1"/>
<layer val="0"/>
<labelMode val="1"/>
<slider min="0.0" max="20.0" absoluteScreenLocation="true" width="100.0" x="30.0" y="50.0" fixed="true" horizontal="true"/>
<lineStyle thickness="13" type="0"/>
<animation step="2.0" speed="1.0" type="0" playing="false"/>
</element>
<command name="numline">
<input a0="n"/>
<output a0="XAxis" a1="刻度座標" a2="刻度"/>
</command>
<element type="vector" label="XAxis">
<lineStyle thickness="10" type="0"/>
<show object="true" label="false"/>
<objColor r="51" g="102" b="0" alpha="0.0"/>
<layer val="0"/>
<labelMode val="0"/>
<coords x="18.0" y="0.0" z="0.0"/>
<lineStyle thickness="10" type="0"/>
<coordStyle style="cartesian"/>
<startPoint x="-9.0" y="0.0" z="1.0"/>
</element>
<element type="list" label="刻度座標">
<lineStyle thickness="2" type="0"/>
<show object="true" label="true"/>
<objColor r="0" g="110" b="0" alpha="0.0"/>
<layer val="0"/>
<labelMode val="0"/>
<pointSize val="3"/>
<pointStyle val="-1"/>
</element>
<element type="list" label="刻度">
<lineStyle thickness="5" type="0"/>
<show object="true" label="true"/>
<objColor r="153" g="0" b="51" alpha="0.0"/>
<layer val="0"/>
<labelMode val="0"/>
<pointSize val="3"/>
<pointStyle val="-1"/>
</element>
<command name="Intersect">
<input a0="xAxis" a1="yAxis"/>
<output a0="O"/>
</command>
<element type="point" label="O">
<show object="true" label="true"/>
<objColor r="0" g="102" b="255" alpha="0.0"/>
<layer val="0"/>
<labelOffset x="-8" y="49"/>
<labelMode val="0"/>
<coords x="0.0" y="-0.0" z="1.0"/>
<pointSize val="8"/>
</element>
<element type="point" label="A">
<show object="false" label="false"/>
<objColor r="204" g="0" b="0" alpha="0.0"/>
<layer val="0"/>
<labelMode val="0"/>
<fixed val="true"/>
<coords x="-9.68" y="1.6" z="1.0"/>
<pointSize val="2"/>
</element>
<command name="Segment">
<input a0="A" a1="A + (2.0, 0.0)"/>
<output a0="L_1"/>
</command>
<element type="segment" label="L_1">
<lineStyle thickness="13" type="0"/>
<show object="true" label="false"/>
<objColor r="204" g="0" b="0" alpha="0.0"/>
<layer val="0"/>
<labelMode val="0"/>
<coords x="0.0" y="2.0" z="-3.1999999999999993"/>
<lineStyle thickness="13" type="0"/>
<eqnStyle style="implicit"/>
<outlyingIntersections val="false"/>
<keepTypeOnTransform val="true"/>
</element>
<command name="Point">
<input a0="L_1"/>
<output a0="P_1"/>
</command>
<element type="point" label="P_1">
<show object="true" label="false"/>
<objColor r="125" g="125" b="255" alpha="0.0"/>
<layer val="0"/>
<labelMode val="0"/>
<animation step="0.1" speed="1.0" type="0" playing="false"/>
<coords x="-8.86" y="1.5999999999999996" z="1.0"/>
<pointSize val="6"/>
</element>
<expression label="va" exp="floor((x(P_1) - x(A)) * n / 2.0) - n / 2.0" />
<element type="numeric" label="va">
<value val="-2.0"/>
<objColor r="0" g="0" b="0" alpha="0.1"/>
</element>
<expression label="文字1" exp=""a = " + va" />
<element type="text" label="文字1">
<show object="true" label="true"/>
<objColor r="0" g="0" b="255" alpha="0.0"/>
<layer val="0"/>
<labelMode val="0"/>
<font serif="false" size="4" style="1"/>
<startPoint exp="P_1"/>
<labelOffset x="-2" y="-19"/>
</element>
<element type="boolean" label="b">
<value val="false"/>
<show object="true" label="true"/>
<objColor r="0" g="0" b="0" alpha="0.0"/>
<layer val="0"/>
<labelOffset x="20" y="352"/>
<labelMode val="0"/>
<auxiliary val="true"/>
<checkbox fixed="true"/>
<caption val="大於或小於"/>
</element>
<element type="boolean" label="equal">
<value val="false"/>
<show object="true" label="true"/>
<objColor r="0" g="0" b="0" alpha="0.0"/>
<layer val="0"/>
<labelOffset x="21" y="383"/>
<labelMode val="0"/>
<auxiliary val="true"/>
<checkbox fixed="true"/>
<caption val="附加等於"/>
</element>
<expression label="solline" exp="{Segment[(va, 0.0), (va, 1.0)], Segment[(va, 1.0), (n / 2.0 * If[b, 1.0, -1.0], 1.0)]}" />
<element type="list" label="solline">
<lineStyle thickness="6" type="0"/>
<show object="true" label="true"/>
<condition showObject="q ∧ c_1"/>
<objColor r="51" g="102" b="255" alpha="0.0"/>
<layer val="0"/>
<labelMode val="0"/>
<pointSize val="3"/>
<pointStyle val="-1"/>
</element>
<expression label="P_2" exp="(va, 0.0)" type="point" />
<element type="point" label="P_2">
<show object="true" label="false"/>
<condition showObject="equal ∧ q ∧ c_1"/>
<objColor r="204" g="0" b="51" alpha="0.0"/>
<layer val="0"/>
<labelMode val="0"/>
<coords x="-2.0" y="0.0" z="1.0"/>
<pointSize val="8"/>
</element>
<expression label="P_3" exp="(va, 0.0)" type="point" />
<element type="point" label="P_3">
<show object="true" label="false"/>
<condition showObject="(¬equal) ∧ q ∧ c_1"/>
<objColor r="204" g="0" b="51" alpha="0.0"/>
<layer val="0"/>
<labelMode val="0"/>
<coords x="-2.0" y="0.0" z="1.0"/>
<pointSize val="8"/>
<pointStyle val="2"/>
</element>
<element type="boolean" label="q">
<value val="false"/>
<show object="true" label="true"/>
<objColor r="0" g="0" b="0" alpha="0.0"/>
<layer val="0"/>
<labelOffset x="19" y="292"/>
<labelMode val="0"/>
<auxiliary val="true"/>
<checkbox fixed="true"/>
<caption val="不等式"/>
</element>
<element type="boolean" label="c_1">
<value val="false"/>
<show object="true" label="true"/>
<objColor r="0" g="0" b="0" alpha="0.0"/>
<layer val="0"/>
<labelOffset x="20" y="322"/>
<labelMode val="0"/>
<auxiliary val="true"/>
<checkbox fixed="true"/>
<caption val="圖解"/>
</element>
<element type="boolean" label="c_5">
<value val="false"/>
<show object="true" label="true"/>
<objColor r="0" g="0" b="0" alpha="0.0"/>
<layer val="0"/>
<labelOffset x="21" y="416"/>
<labelMode val="0"/>
<auxiliary val="true"/>
<checkbox fixed="true"/>
<caption val="操作說明"/>
</element>
<expression label="文字3" exp=""1. 拉動 n 數值滑桿,決定數線大小 2. 拉動 a 滑桿,決定此不等式 3. 點選各勾選框,決定物件是否顯示 4. 選擇功能按鈕的移動鈕,可以移動整個坐標平面 5. 要複製圖片到文書編輯器,請以滑鼠選擇複製範圍後 按 Ctrl-Shift-C,即可複製到剪貼簿中,在文書編輯器中按Ctrl-V貼上""/>
<element type="text" label="文字3">
<show object="true" label="false"/>
<condition showObject="c_5"/>
<objColor r="0" g="102" b="255" alpha="0.0"/>
<layer val="0"/>
<labelMode val="0"/>
<font serif="false" size="4" style="1"/>
<absoluteScreenLocation x="167" y="314"/>
</element>
<expression label="文字2" exp=""x" + (If[b, If[equal, " ≥ ", " > "], If[equal, " ≤ ", " < "]]) + va" />
<element type="text" label="文字2">
<show object="true" label="true"/>
<condition showObject="q"/>
<objColor r="0" g="51" b="255" alpha="0.0"/>
<layer val="0"/>
<labelMode val="0"/>
<font serif="false" size="6" style="1"/>
<startPoint x="-6.2" y="3.400000000000001" z="1.0"/>
</element>
</construction>
</geogebra>