
Opening Size of a Quadratic Function vs. Leading Coefficient
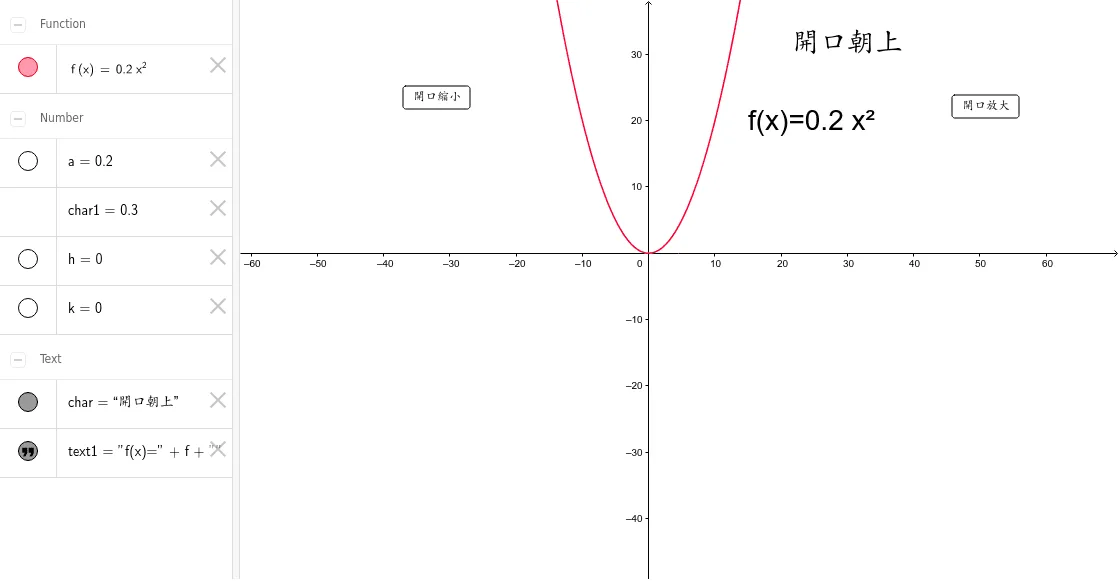
This interactive GeoGebra applet explores the fundamental relationship between the opening size, or width, of a quadratic function and its leading coefficient. In the standard form of a quadratic equation, the leading coefficient plays a crucial role in determining the geometric shape of the graph. This tool provides a dynamic, visual environment where students can investigate how changes in this specific algebraic parameter directly affect the curvature and spread of the resulting parabola.
Users interact with the applet primarily through an adjustable slider that controls the numerical value of the leading coefficient. As the slider is dragged across different values, the graph of the quadratic function updates in real time, allowing for immediate visual feedback. This hands-on manipulation enables learners to test hypotheses and observe continuous transformations of the curve without the tedious and time-consuming process of manually plotting coordinate points on graph paper.
The core mathematical concept demonstrated is the precise effect of the absolute value of the leading coefficient on the width of the parabola. Through guided experimentation, students will clearly observe that as the absolute value of the coefficient increases, the parabola becomes noticeably narrower and steeper, appearing to compress toward the y-axis. Conversely, as the absolute value decreases and approaches zero, the parabola becomes significantly wider and flatter, stretching outward along the x-axis. The applet also elegantly separates the concept of width from the direction of the opening. By moving the slider into negative values, students can verify that while the sign of the coefficient dictates whether the parabola opens upward or downward, it is strictly the absolute value that governs the physical opening size.
For middle and high school mathematics students, this applet serves as an invaluable educational resource. It effectively bridges the gap between abstract algebraic expressions and concrete geometric representations, fostering a deeper conceptual understanding of function transformations. By visually internalizing the geometric meaning of the coefficients, students build a strong foundational intuition that will aid them in more advanced mathematical topics, such as analyzing rates of change, solving optimization problems, and mastering curve sketching. Ultimately, this interactive demonstration transforms a static textbook rule into an engaging and easily discoverable mathematical truth.
Loading the math board and drawing, please wait…